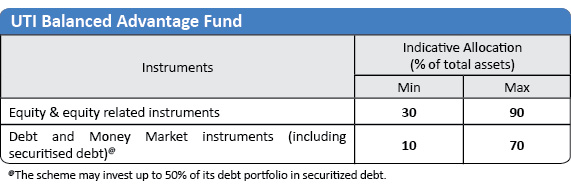
| Investment Objective The scheme intends to provide long-term capital appreciation and income by investing in a dynamically managed portfolio of equity and debt instruments. However, there is no assurance or guarantee that the investment objective of the scheme will be achieved. |
|||||||||
Date of inception/allotment |
10th August, 2023 | ||||||||
Fund Manager |
Mr. Sachin Trivedi (Equity Portion) B.Com, MMS, CFA. Managing this scheme since August 2023. Total Exp: 24 Yrs Mr. Anurag Mittal (Debt Portion) B.Com, Master of Science, Chartered Accountant. Managing this scheme since August 2023. Total Exp: 15 Yrs |
||||||||
Fund AUM/Folio as on 31st July, 2026 |
Fund Size Monthly Average : 3,047.07 Crore Closing AUM : 3,073.10 Crore No. of Folios : 88,879 |
||||||||
High/Low NAV in the month |
High Growth Option : 12.6523 Low Growth Option : 12.3900 |
||||||||
Month-end Total Expense Ratio (%)* |
Regular : 1.97 Direct : 0.72 *For detailed YTD Total Expense Ratio refer to Click Here |
||||||||
Minimum Investment Amount |
Minimum initial investment is Rs. 5,000/- and in multiples of Re.1/- thereafter. | ||||||||
Plans/Options
(Regular / Direct) |
Growth Option IDCW Option with Payout Option |
||||||||
Market Capitalisation (%) |
|
||||||||
Portfolio Parameters |
Weighted Average Maturity : 1.71 Yrs Yield to Maturity* : 6.74% Modified Duration : 1.44 Yrs Macaulay Duration: 1.52 Yrs *Annualized Portfolio YTM – Yields of all securities are annualized |
||||||||
Load Structure |
Entry Load *: Nil (Not Applicable as per SEBI guidelines) Exit Load: (A) Redemption / Switch out within 90 days from the date of allotment – 1.00% (B) Redemption / Switch out after 90 days from the date of allotment – NIL |
||||||||
NAV per unit as on 31st July, 2026 |
Regular Growth Option 12.6523 Regular IDCW Option 12.6524 Direct Growth Option 13.1781 Direct IDCW Option 13.1781 |
||||||||
Benchmark Index |
Nifty 50 Hybrid Composite Debt 50:50 Index | ||||||||
| *In terms of provision no. 11.7.1 of para 11.7 under Chapter 11 of SEBI Master Circular for Mutual Funds no entry load will be charged by the Scheme to the investor | |||||||||
| Financial Services | 40% |
| Information Technology | 9% |
| Oil, Gas & Consumable Fuels | 9% |
| Automobile and Auto Components | 8% |
| Telecommunication | 5% |
| Portfolio | % of Nav | Rating | Futures |
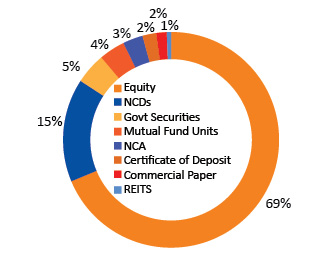
| Equity | |||
| HDFC Bank Ltd. | 7.07 | ||
| ICICI Bank Ltd | 6.67 | ||
| Reliance Industries Ltd. | 4.39 | ||
| Bharti Airtel Ltd. | 3.65 | ||
| Infosys Ltd. | 3.20 | ||
| Bajaj Finance Ltd. | 2.94 | ||
| Kotak Mahindra Bank Ltd. | 2.86 | ||
| Axis Bank Ltd. | 2.52 | ||
| State Bank Of India | 2.47 | ||
| Mahindra & Mahindra Ltd. | 2.16 | ||
| Titan Company Ltd. | 1.94 | ||
| Larsen And Toubro Ltd | 1.74 | ||
| Ultratech Cement Ltd. | 1.30 | ||
| Tata Consultancy Services Ltd. | 1.27 | ||
| Maruti Suzuki India Ltd. | 1.13 | ||
| ITC Ltd. | 1.03 | ||
| Adani Ports And Special Economic Zone Ltd | 0.95 | ||
| Mphasis Ltd | 0.88 | ||
| Coal India Ltd. | 0.87 | ||
| Eicher Motors Ltd | 0.82 | ||
| Dr. Lal Pathlabs Ltd. | 0.80 | ||
| Ajanta Pharma Ltd | 0.77 | ||
| Aurobindo Pharma Ltd. | 0.71 | ||
| SBI Life Insurance Company Ltd. | 0.68 | ||
| Hyundai Motor India Ltd | 0.66 | ||
| Oil & Natural Gas Corporation Ltd. | 0.65 | ||
| Container Corporation Of India Ltd | 0.64 | ||
| Crompton Greaves Consumer Electricals Ltd. | 0.63 | ||
| Info-Edge (India) Ltd. | 0.63 | ||
| NTPC Ltd. | 0.63 | ||
| Marico Ltd. | 0.59 | ||
| Hero Motocorp Ltd. | 0.50 | ||
| ICICI Lombard General Insurance Company Ltd | 0.50 | ||
| Oil India Ltd. | 0.50 | ||
| Blue Star Ltd | 0.48 | ||
| HDFC Life Insurance Company Ltd | 0.48 | ||
| JSW Steel Ltd. | 0.48 | ||
| DLF Ltd. | 0.46 | ||
| Glenmark Pharmaceuticals Ltd | 0.43 | ||
| Asian Paints Ltd. | 0.38 | ||
| Adani Enterprises Ltd. | 0.34 | ||
| Hindustan Aeronautics Ltd | 0.32 | ||
| NIIT Learning Systems Ltd | 0.32 | ||
| Avenue Supermarts Ltd. | 0.20 | ||
| Wipro Ltd. | 0.11 | ||
| Biocon Ltd. | 0.10 | ||
| TVS Motor Company Ltd | 0.05 | ||
| Interglobe Aviation Ltd | 0.03 | ||
| Bharat Petroleum Corporation Ltd. | 0.00 | ||
| Vedanta Ltd | 0.00 | ||
| Govt Securities | |||
| 7.06% GS MAT - 10/04/2028 | 3.47 | SOV | |
| 7.10% GSEC - MAT - 08/04/2034 | 0.83 | SOV | |
| 07.18% GSEC MAT -24/07/2037 | 0.33 | SOV | |
| NCDs | |||
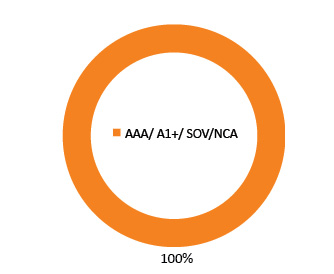
| 7.56% UNSEC REC SERIES 236-B 31/08/2027 | 2.45 | ICRA AAA | |
| 7.14% URNCD EXIM BANK (Series - AA01 2029) 13/12/2029 | 1.95 | ICRA AAA | |
| 07.40% UNSEC Exim Bank (Series - Z 02-2029) 14-Mar-2029 | 1.64 | CRISIL AAA | |
| 7.38% SRNCD BAJAJ FIN (SR 289 OPT-1)-28/06/2030 | 1.28 | CRISIL AAA | |
| 7.85% URNCD PFC (SR177)-03/04/2028 | 0.82 | CRISIL AAA | |
| 7.83% URNCD SIDBI SERIES-V MAT-24/11/2028 | 0.82 | CRISIL AAA | |
| 08.65% UNSEC BHARTI TELECOM LTD (SERIES XIX) 05-NOV-2027 | 0.82 | CRISIL AAA | |
| 7.45% URNCD EXIM (SR Z-01-28) 12/04/28 | 0.82 | CRISIL AAA | |
| 7.48% URNCD SIDBI 2030 (SR- VI) 24/05/2029 | 0.81 | CRISIL AAA | |
| 7.51% UNCD SIDBI 2029 - Series V 12/06/2028 | 0.81 | CRISIL AAA | |
| 7.34% UNCD SIDBI 2029 - Series III 26/02/2029 | 0.81 | CRISIL AAA | |
| 7.60% POONAWALA FINCORP SR.B2 FY2025-26 28/05/2027 | 0.81 | CRISIL AAA | |
| 07.6164% SRNCD ADITYA BIRLA HSG FIN-(SR-A1)-25/01/2029 | 0.81 | CRISIL AAA | |
| 07.71% UNSEC REC 230-A 26/02/2027 | 0.33 | CRISIL AAA | |
| 08.10% TCHFL SNCD “D” Series FY 2023-24 -19/02/2027 | 0.16 | CRISIL AAA | |
| 7.14% SRNCD BAJAJ HSG FIN (SR 32-TR7) 26/02/27 | 0.16 | CRISIL AAA | |
| 07.30% UNSEC BHARTI TELECOM LTD (SERIES XXVII) 01-DEC-2027 | 0.16 | CRISIL AAA | |
| Commercial Paper | |||
| EXIM Bank - 25/01/2027 | 1.57 | CRISIL A1+ | |
| Certificate Of Deposit | |||
| Small Indst. Dev. Bank Of India - 10/11/2026 | 0.80 | CARE A1+ | |
| ICICI Bank Ltd - 08/03/2027 | 0.78 | ICRA A1+ | |
| Canara Bank - 28/01/2027 | 0.31 | CRISIL A1+ | |
| Kotak Mahindra Bank Ltd - 29/01/2027 | 0.16 | CRISIL A1+ | |
| Mutual Fund Units | |||
| UTI - Floater Fund- Direct Growth | 3.48 | ||
| UTI NIFTY 1D Rate Liquid ETF – Growth ETF | 0.33 | ||
| UTI NIFTY 10 yr Benchmark G-Sec ETF | 0.04 | ||
| UTI NIFTY 5 yr Benchmark G-Sec ETF | 0.04 | ||
| REITS | |||
| REIT - Bagmane Prime Office | 0.63 | ||
| Net Current assets | 3.04 | ||
| Total | 100.00 | ||
Median Market Cap ( Cr) |
4,49,281 |
Weighted Average Market Cap |
6,39,780 |
Number of Securities |
61 |
All figures given are provisional and unaudited.
| |
Quantitative Indicators |
Fund |
Benchmark |
Portfolio Turnover Ratio |
1.00 |
|
P/B |
3.13 |
3.06 |
P/E |
21.43 |
21.63 |
| ROE | 18.06 |
18.51 |
Calculation Methodology: P/E and P/B are based on harmonic mean: ROE is calculated as a weighted average. All figures are based on trailing twelve months (TTM) data.
| Fund Performance Vs Benchmark (CAGR) as on 31st July, 2026 Growth of 10000
|
||||||
| Period | NAV Growth (%) |
NIFTY 50 Hybrid Composite Debt 50:50 (%) |
Nifty 50 TRI (%) |
NAV Growth () |
NIFTY 50 Hybrid Composite Debt 50:50 () |
Nifty 50 TRI () |
| 1 Y | 0.69 | 1.15 | -0.43 | 10,069 | 10,115 | 9,957 |
| SI* | 8.23 | 7.83 | 8.99 | 12,653 | 12,514 | 12,919 |
Past performance may or may not be sustained in future. Different plans have a different expense structure. The performance details provided herein are of regular plan. The Schemes is Managed by Mr. Sachin Trivedi & Mr Anurag Mittal. Please refer page no. 78 for FPI Performance. The performance of the benchmark is calculated using total return index variant of the benchmark index. Load is not taken into consideration for computation of performance. *Compounded annualized Growth Rate
| Period | |||||||
|
Investment Amount ()
|
Fund Value
() |
Value-NIFTY 50 Hybrid Composite Debt 50:50 Index
() |
Value-Nifty 50 TRI
() |
Yield (%) Fund
|
Yield (%)
NIFTY 50 Hybrid Composite Debt 50:50 Index |
Yield (%)
Nifty 50 TRI |
|
| 1 Y | 1,20,000 | 1,20,933 | 1,21,077 | 1,19,609 | 1.45 | 1.68 | -0.61 |
| SI | 3,50,000 | 3,75,275 | 3,76,005 | 3,72,049 | 4.72 | 4.85 | 4.13 |
Note: Systematic Investment Plan (SIP) returns are worked out assuming investment of 10,000/- every month at NAV per unit of the scheme as on the first working day for the respective time periods. The loads have not been taken into account. Past performance may or may not be sustained in future.
This product is suitable for investors who are seeking*:
- Long term capital appreciation and income
- Investment in a dynamically managed portfolio of equity and debt instruments
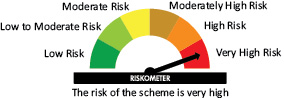
*Investors should consult their financial advisers if in doubt about whether the product is suitable for them.