| Investment Objective The scheme seeks to generate long term capital appreciation by investing across asset classes. However, there is no assurance or guarantee that the investment objective of the scheme will be achieved. |
|||||||||||||
Date of inception/allotment |
19th November, 2008 | ||||||||||||
Fund Manager |
Mr. Sharwan Kumar Goyal, B.com, CFA, MMS (Equity Portion) Managing the scheme since Nov 2021 Total Exp: 19 Yrs Mr. Jaydeep Bhowal - B.Com, CA, PGDFM Managing the scheme since Oct 2024 Total Exp: 16 Yrs Mr. Lokesh Kulthia (Asst. Fund Manager) - B.Com (Hons), MBA (Finance), PGPFM, EPAT, Managing the scheme Since June, 2026 Total Exp: 7 Yrs |
||||||||||||
Fund AUM/Folio as on 31st July, 2026 |
Fund Size Monthly Average : 6,956.71 Crore Closing AUM : 6,998.04 Crore No. of Folios : 2,18,328 |
||||||||||||
High/Low NAV in the month |
High Growth Option : 79.0729 Crore Low Growth Option : 77.4220 Crore |
||||||||||||
Month-end Total Expense Ratio (%)* |
Regular : 1.86 Direct : 0.78 *For detailed YTD Total Expense Ratio refer to Click Here |
||||||||||||
Minimum Investment Amount |
Minimum initial investment of 5000/-and in multiples of 1/- thereafter with no upper limit. | ||||||||||||
Plans/Options
(Regular / Direct) |
Growth option IDCW option with Payout and Reinvestment |
||||||||||||
Market Capitalisation (%) |
|
||||||||||||
Portfolio Parameters |
Weighted Average Maturity : 7.13 Yrs Yield to Maturity* : 6.84% Modified Duration: 3.83 Yrs Macaulay Duration: 4.02 Yrs *Annualized Portfolio YTM – Yields of all securities are annualized |
||||||||||||
Load Structure |
Entry Load : Nil Exit Load*: (A) Redemption / Switch out within 30 days from the date of allotment – 1.00% (B) Redemption / Switch out after 30 days from the date of allotment – NIL (*wef September 05, 2024) |
||||||||||||
NAV per unit as on 31st July, 2026 |
Regular Growth Option 79.0729 Regular IDCW Option 29.5774 Direct Growth Option 88.6822 Direct IDCW Option 34.8095 |
||||||||||||
Benchmark Index |
65% BSE 200 TRI + 25% CRISIL Composite Bond Index + 7% Domestic Price of Gold + 2% Domestic Price of Silver + 1% iCOMDEX Composite Index | ||||||||||||
Overweight (Top 5) |
% |
Underweight (Top 5) |
% |
| ICICI Bank Ltd | 3.3 | Silver Bullion | -1.0 |
| Nestle India Ltd | 2.8 | Larsen And Toubro Ltd | 0.0 |
| Kotak Mahindra Bank Ltd | 2.8 | Bajaj Finance Ltd | 0.0 |
| ITC Ltd | 2.6 | Mahindra & Mahindra Ltd | 0.0 |
| Eternal Ltd | 0.0 |
UTI Multi Asset Allocation Fund ( Erstwhile UTI Multi Asset Fund ) - IDCW Declared |
||||||
Year |
IDCW |
Rs. Per unt |
NAV (Cum Div ) |
Face Value (per unit) |
NAV Date |
Record Date |
| 2020 | 0.85% | 0.85 | 17.6864 | 10 | 17-02-2020 | 24-02-2020 |
| 2020 | 0.85% | 0.85 | 15.3095 | 10 | 16-03-2020 | 23-02-2020 |
| 2020 | 0.85% | 0.085 | 15.9355 | 10 | 15-06-2020 | 22-06-2020 |
| 2020 | 0.85% | 0.085 | 16.8188 | 10 | 15-07-2020 | 22-07-2020 |
| 2020 | 0.80% | 0.085 | 17.7898 | 10 | 18-08-2020 | 25-08-2020 |
| 2020 | 0.85% | 0.085 | 17.7579 | 10 | 16-09-2020 | 23-09-2020 |
| 2020 | 0.85% | 0.085 | 17.7479 | 10 | 19-10-2020 | 26-10-2020 |
| 2020 | 0.85% | 0.085 | 18.3413 | 10 | 18-11-2020 | 25-11-2020 |
| 2020 | 0.85% | 0.085 | 18.6632 | 10 | 16-12-2020 | 23-12-2020 |
| 2021 | 0.85% | 0.085 | 18.9348 | 10 | 18-01-2021 | 25-01-2021 |
| 2021 | 0.85% | 0.085 | 19.2624 | 10 | 17-02-2021 | 24-02-2021 |
| 2021 | 0.85% | 0.085 | 19.0502 | 10 | 15-03-2021 | 22-03-2021 |
| 2021 | 0.85% | 0.085 | 18.7674 | 10 | 19-04-2021 | 26-04-2021 |
| 2021 | 0.85% | 0.085 | 19.5092 | 10 | 16-06-2021 | 23-06-2021 |
| 2021 | 0.85% | 0.085 | 19.6211 | 10 | 15-07-2021 | 22-07-2021 |
| 2021 | 0.85% | 0.085 | 19.814 | 10 | 16-08-2021 | 23-08-2021 |
| 2021 | 0.85% | 0.085 | 20.3691 | 10 | 15-09-2021 | 22-09-2021 |
| 2022 | 2.55% | 0.255 | 20.508 | 10 | 17-01-2022 | 24-01-2022 |
| 2022 | 2.55% | 0.255 | 19.5998 | 10 | 19-04-2022 | 26-04-2022 |
| 2022 | 2.55% | 0.255 | 18.7219 | 10 | 19-07-2022 | 26-07-2022 |
| 2022 | 2.55% | 0.255 | 19.4689 | 10 | 13-10-2022 | 20-10-2022 |
| 2023 | 2.55% | 0.255 | 19.8305 | 10 | 16-01-2023 | 20-01-2023 |
| 2023 | 2.55% | 0.255 | 20.0121 | 10 | 17-04-2023 | 21-04-2023 |
| 2023 | 2.55% | 0.255 | 21.641 | 10 | 17-07-2023 | 21-07-2023 |
| 2023 | 2.55% | 0.255 | 22.1891 | 10 | 16-10-2023 | 20-10-2023 |
| 2024 | 2.55% | 0.255 | 24.7008 | 10 | 10-01-2024 | 16-01-2024 |
| 2024 | 2.55% | 0.255 | 26.772 | 10 | 16-04-2024 | 23-04-2024 |
| 2024 | 2.55% | 0.255 | 28.4506 | 10 | 10-07-2024 | 16-07-2024 |
| 2024 | 2.55% | 0.255 | 29.373 | 10 | 04-10-2024 | 10-10-2024 |
| 2025 | 2.55% | 0.255 | 28.2782 | 10 | 10-01-2025 | 16-01-2025 |
| 2025 | 2.55% | 0.255 | 27.9673 | 10 | 17-04-2025 | 24-04-2025 |
| 2025 | 2.55% | 0.255 | 29.2398 | 10 | 04-07-2025 | 10-07-2025 |
| 2025 | 2.55% | 0.255 | 29.6576 | 10 | 10-10-2025 | 16-10-2025 |
| 2026 | 2.55% | 0.255 | 30.3212 | 10 | 09-01-2026 | 16-01-2026 |
| 2026 | 2.55% | 0.255 | 29.7208 | 10 | 17-04-2026 | 23-04-2026 |
| 2026 | 2.55% | 0.255 | 29.5601 | 10 | 17-07-2026 | 23-07-2026 |
The scheme IDCW details under regular plan.
Disclaimer: Pursuant to payment of Dividend/Bonus, the Nav of the income distribution cum capital withdrawal options of the schemes would fall to the extent of payout and statutory levy (if applicable)
| Financial Services | 29% |
| Fast Moving Consumer Goods | 14% |
| Information Technology | 11% |
| Capital Goods | 9% |
| Consumer Durables | 6% |
| Portfolio | % of Nav |
Rating |
Futures |
| Equity | |||
| ICICI Bank Ltd | 3.32 | ||
| Nestle India Ltd. | 2.80 | ||
| Kotak Mahindra Bank Ltd. | 2.78 | ||
| HDFC Bank Ltd. | 2.67 | ||
| ITC Ltd. | 2.62 | ||
| Tata Consultancy Services Ltd. | 2.59 | ||
| Infosys Ltd. | 1.81 | ||
| Bharat Electronics Ltd. | 1.73 | ||
| Asian Paints Ltd. | 1.69 | ||
| Interglobe Aviation Ltd | 1.67 | ||
| Britannia Industries Ltd. | 1.66 | ||
| Cummins India Ltd. | 1.65 | ||
| State Bank Of India | 1.61 | ||
| Titan Company Ltd. | 1.57 | ||
| Bharti Airtel Ltd. | 1.52 | ||
| HCL Technologies Ltd. | 1.49 | ||
| Coal India Ltd. | 1.35 | ||
| Eicher Motors Ltd | 1.27 | ||
| Marico Ltd. | 1.02 | ||
| BSE Ltd | 1.01 | ||
| The Federal Bank Ltd | 0.99 | ||
| Shriram Finance Ltd | 0.96 | ||
| Colgate Palmolive India Ltd. | 0.94 | ||
| Laurus Labs Ltd. | 0.92 | ||
| AU Small Finance Bank Ltd | 0.90 | ||
| Dixon Technologies (India) Ltd | 0.90 | 0.24 | |
| Multi Commodity Exchange Of India Ltd | 0.90 | ||
| HDFC Asset Management Company Ltd | 0.89 | ||
| Hero Motocorp Ltd. | 0.86 | ||
| Axis Bank Ltd. | 0.79 | ||
| Pidilite Industries Ltd. | 0.79 | ||
| Sun Pharmaceuticals Industries Ltd. | 0.75 | ||
| Hindustan Unilever Ltd. | 0.72 | ||
| Maruti Suzuki India Ltd. | 0.72 | ||
| Reliance Industries Ltd. | 0.72 | ||
| Hindustan Zinc Ltd. | 0.71 | ||
| Ge Vernova T & D India Ltd | 0.70 | ||
| Bharat Forge Ltd. | 0.67 | ||
| Indus Towers Ltd | 0.65 | ||
| Suzlon Energy Ltd. | 0.65 | ||
| Persistent Systems Ltd. | 0.62 | ||
| Ashok Leyland Ltd. | 0.60 | ||
| Torrent Pharmaceuticals Ltd. | 0.60 | 0.07 | |
| Hyundai Motor India Ltd | 0.52 | ||
| Solar Industries India Ltd. | 0.52 | ||
| Aditya Birla Capital Ltd | 0.49 | ||
| Vedanta Aluminium Metal Ltd. | 0.49 | ||
| Page Industries Ltd | 0.48 | ||
| Max Financial Services Ltd. | 0.47 | ||
| Ultratech Cement Ltd. | 0.47 | ||
| Indian Bank | 0.39 | ||
| Polycab India Ltd | 0.39 | ||
| LTM Ltd | 0.37 | ||
| Delhivery Ltd. | 0.35 | ||
| Navin Fluorine International Tld. | 0.33 | ||
| The Karur Vysya Bank Ltd | 0.33 | ||
| Oracle Financial Services Software Ltd. | 0.32 | ||
| Apollo Hospitals Enterprise Ltd. | 0.30 | ||
| Vedanta Ltd | 0.30 | ||
| Glenmark Pharmaceuticals Ltd | 0.29 | ||
| Muthoot Finance Ltd | 0.28 | ||
| Bajaj Finserv Ltd. | 0.27 | ||
| SBI Life Insurance Company Ltd. | 0.27 | ||
| Computer Age Management Services Ltd | 0.25 | ||
| Abbott India Ltd. | 0.24 | ||
| Acutaas Chemicals Ltd | 0.23 | ||
| Indian Railway Catering & Tourism Ltd | 0.23 | ||
| Nippon Life India Asset Management Ltd | 0.23 | ||
| Central Depository Services (India) Ltd | 0.22 | ||
| Dr Reddy's Laboratories Ltd. | 0.20 | ||
| HDFC Life Insurance Company Ltd | 0.20 | ||
| MTAR Technologies Ltd | 0.18 | ||
| Great Eastern Shipping Co. Ltd. | 0.17 | ||
| Procter & Gamble Hygiene & Hel Care Ltd. | 0.13 | ||
| TD Power Systems Ltd. | 0.13 | ||
| Fortis Healthcare Ltd. | 0.12 | ||
| Tata Elxsi Ltd. | 0.12 | ||
| ICICI Lombard General Insurance Company Ltd | 0.11 | ||
| Dabur India Ltd. | 0.09 | ||
| Shree Cement Ltd. | 0.09 | ||
| Emami Ltd. | 0.07 | ||
| Emcure Pharmaceuticals Ltd | 0.06 | ||
| MRF Ltd. | 0.06 | ||
| Triveni Turbine Ltd | 0.05 | ||
| Eclerx Services Ltd. | 0.04 | ||
| Indiamart Intermesh Ltd | 0.04 | ||
| Vedanta Iron And Steel Ltd. | 0.04 | ||
| Vedanta Oil And Gas Ltd | 0.04 | ||
| Vedanta Power Ltd. | 0.04 | ||
| KPIT Technologies Ltd | 0.00 | 0.11 | |
| Relaxo Footwears Ltd | 0.00 | ||
| NIFTY Futures | 3.41 | ||
| Govt Securities | |||
| 7.24% GSEC MAT- 18/08/2055 | 1.18 | SOV | |
| 7.79% WESTBENGAL SGS Mat - 18/03/2045 | 0.36 | SOV | |
| 07.72% WESTBENGAL SGS Mat - 25/02/2041 | 0.36 | SOV | |
| 6.68% GSEC MAT- 07/07/2040 | 0.35 | SOV | |
| 7.08% A P SGL MAT - 26/03/2037 | 0.35 | SOV | |
| 7.34% GSEC MAT- 22/04/2064 | 0.35 | SOV | |
| 06.90% BIHAR SDL - 16/07/2035 | 0.35 | SOV | |
| 07.32% GSEC MAT -13/11/2030 | 0.30 | SOV | |
| 7.74% WEST BENGAL SGS Mat - 18/02/2044 | 0.14 | SOV | |
| 07.06% GSEC Mat- 27/07/2041 | 0.14 | SOV | |
| 07.81% UTTAR PRADESH SGS Mat - 11/02/2041 | 0.11 | SOV | |
| 7.10% GSEC - MAT - 08/04/2034 | 0.07 | SOV | |
| 7.88% UTTARPRADESH SGS 25/03/2046 | 0.07 | SOV | |
| 7.72% WESTBENGAL SGS Mat - 11/03/2044 | 0.05 | SOV | |
| 6.90% GSEC MAT - 15/04/2065 | 0.00 | SOV | |
| Long Term Debt | |||
| NATIONAL BANK FOR AGRICULTURE AND RURAL DEVELOPMENT | 0.72 | CRISIL AAA | |
| EXPORT IMPORT BANK OF INDIA | 0.71 | CRISIL AAA | |
| BAJAJ HOUSING FINANCE LTD | 0.71 | CRISIL AAA | |
| BAJAJ FINANCE LTD. | 0.71 | CRISIL AAA | |
| SMALL INDUSTRIES DEVELOPMENT BANK OF INDIA | 0.71 | CRISIL AAA | |
| HDFC BANK LTD. | 0.36 | CRISIL AAA | |
| MUTHOOT FINANCE LTD | 0.36 | CRISIL AA+ | |
| CHOLAMANDALAM INVESTMENT AND FINANCE COMPANY Ltd | 0.36 | ICRA AA+ | |
| POWER FINANCE CORPORATION LTD. | 0.35 | CRISIL AAA | |
| REC Ltd | 0.34 | CRISIL AAA | |
| CP / CDs | |||
| National Bank For Agriculture And Rural Development | 0.34 | CRISIL A1+ | |
| INVIT | |||
| INVIT - IRB INVIT Fund | 0.75 | ||
| REITS | |||
| REIT- Knowledge Realty Trust REIT | 1.02 | ||
| REIT- Embassy Office Parks | 0.93 | ||
| REIT - Bagmane Prime Office | 0.88 | ||
| REIT- Brookfield India Real Estate Trust | 0.77 | ||
| REIT- Mindspace Business Parks | 0.61 | ||
| Mutual Fund Units | |||
| UTI MF- Gold Exchange Traded Fund ETF | 12.44 | ||
| UTI MF- SILVER EXCHANGE TRADED FUND | 1.00 | ||
| UTI - Floater Fund- Direct Growth | 0.77 | ||
| UTI NIFTY 5 yr Benchmark G-Sec ETF | 0.02 | ||
| UTI NIFTY 10 yr Benchmark G-Sec ETF | 0.02 | ||
| Net Current assets | 4.13 | ||
| Total | 100.00 | ||
% of top 10 stocks |
25.43 |
Median Market Cap ( Cr) |
2,57,657 |
Weighted Average Market Cap |
3,73,093 |
Number of Securities |
91 |
All figures given are provisional and unaudited. |
Fund |
Benchmark |
|
Beta |
0.92 |
1 |
Standard Deviation (Annual) |
9.53% |
9.76% |
Sharpe ratio |
1.03 |
|
| Portfolio Turnover Ratio (Annual) | 1.29 |
|
P/B |
4.95 |
3.21 |
P/E |
25.62 |
22.32 |
| ROE | 27.89 |
18.58 |
Calculation Methodology: P/E and P/B are based on harmonic mean: ROE is calculated as a weighted average. All figures are based on trailing twelve months (TTM) data.
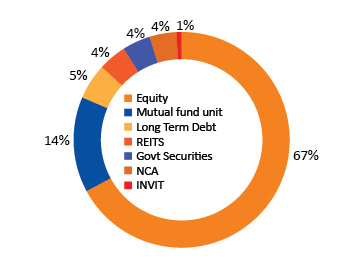
| Fund Performance Vs Benchmark (CAGR) as on 31st July, 2026 Growth of 10000
|
||||||
| Period | NAV Growth (%) |
Benchmark@ (%) |
Nifty 50 TRI (%) |
NAV Growth () |
Benchmark@ () |
Nifty 50 TRI () |
| 1 Y | 7.13 | 7.31 | -0.43 | 10,713 | 10,731 | 9,957 |
| 3 Y | 15.21 | 12.21 | 8.56 | 15,298 | 14,133 | 12,797 |
| 5 Y | 13.36 | 11.51 | 10.40 | 18,726 | 17,246 | 16,404 |
| 5 Y | 10.32 | 12.17 | 12.28 | 26,716 | 31,553 | 31,864 |
| SI* | 12.39 | 14.14 | 14.76 | 79,109 | 1,04,002 | 1,14,472 |
Past performance may or may not be sustained in future. Different plans have a different expense structure. Performance has been computed using values of the concerned benchmarks. From inception till February 14, 2018, the benchmark was S&P BSE 100, Gold ETF & Crisil Bond Fund Index . It was then revised to BSE 200 TRI (65%), CRISIL Composite Bond Index (25%) Price of Gold (10%), till February 27, 2026 and to 65% BSE 200 TRI + 25% CRISIL Composite Bond Index + 7% Domestic Price of Gold + 2% Domestic Price of Silver + 1% iCOMDEX Composite Index from 28th Feb 2026 onwards. N.A - Not Available. The Schemes is managed by the Fund manager Mr. Sharwan Kumar Goyal & Mr. Jaydeep Bhowal. Mr. Lokesh Kulthia (Asst. Fund Manager) Managing the scheme Since June, 2026. The performance of the benchmark is calculated using total return index variant of the benchmark index. Load is not taken into consideration for computation of performance.
| Period | |||||||
Investment Amount () |
Fund Value () |
Benchmark@ () |
Nifty 50 TRI () |
Yield (%) Fund |
Yield (%) Benchmark@ |
Yield (%) Nifty 50 TRI |
|
| 1 Y | 1,20,000 | 1,23,669 | 1,23,750 | 1,19,609 | 5.74 | 5.87 | -0.61 |
| 3 Y | 3,60,000 | 4,16,617 | 4,13,851 | 3,84,933 | 9.74 | 9.28 | 4.40 |
| 5 Y | 6,00,000 | 8,42,022 | 7,94,380 | 7,36,636 | 13.53 | 11.18 | 8.15 |
| 7 Y | 8,40,000 | 13,74,593 | 13,22,521 | 12,67,326 | 13.83 | 12.75 | 11.55 |
| 10 Y | 12,00,000 | 22,56,628 | 23,13,529 | 22,36,430 | 12.14 | 12.59 | 11.97 |
| 15 Y | 18,00,000 | 42,50,621 | 49,46,446 | 48,87,346 | 10.67 | 12.44 | 12.31 |
| SI | 21,10,000 | 57,81,413 | 69,14,739 | 68,51,779 | 10.50 | 12.24 | 12.16 |
Note: Systematic Investment Plan (SIP) returns are worked out assuming investment of 10,000/- every month at NAV per unit of the scheme as on the first working day for the respective time periods. The loads have not been taken into account. Past performance may or may not be sustained in future.
@65% BSE 200 TRI + 25% CRISIL Composite Bond Index + 7% Domestic Price of Gold + 2% Domestic Price of Silver + 1% iCOMDEX Composite Index
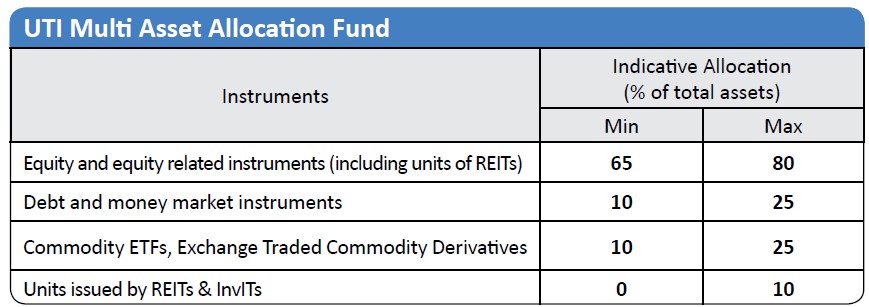
This product is suitable for investors who are seeking*:
- Long term capital appreciation
- Investment in equity, debt and commodities
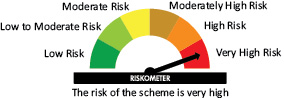
*Investors should consult their financial advisers if in doubt about whether the product is suitable for them.