

Have you ever thought about the FIFA World Cup winners since 1982? 12 tournaments, roughly 31 countries competing on average each time, yet only 6 nations lifted the trophy during that period, and every one of them won it more than once. That's the pattern UTI MF is seeking inspiration from, for its newest index fund. Markets behave the same way, cash gave way to UPI, branch banking gave way to mobile banking, and TV gave way to OTT, but a small set of companies keeps finding a way to stay on top through each shift.
The UTI BSE India Sector Leaders Index Fund and UTI BSE India Sector Leaders Exchange Traded Fund, both funds are structured to hold exactly that group of companies. The NFO runs from 31st August 2026 to 11th September 2026. Let’s look at what both funds invest in and how they are constructed.
What the index actually does
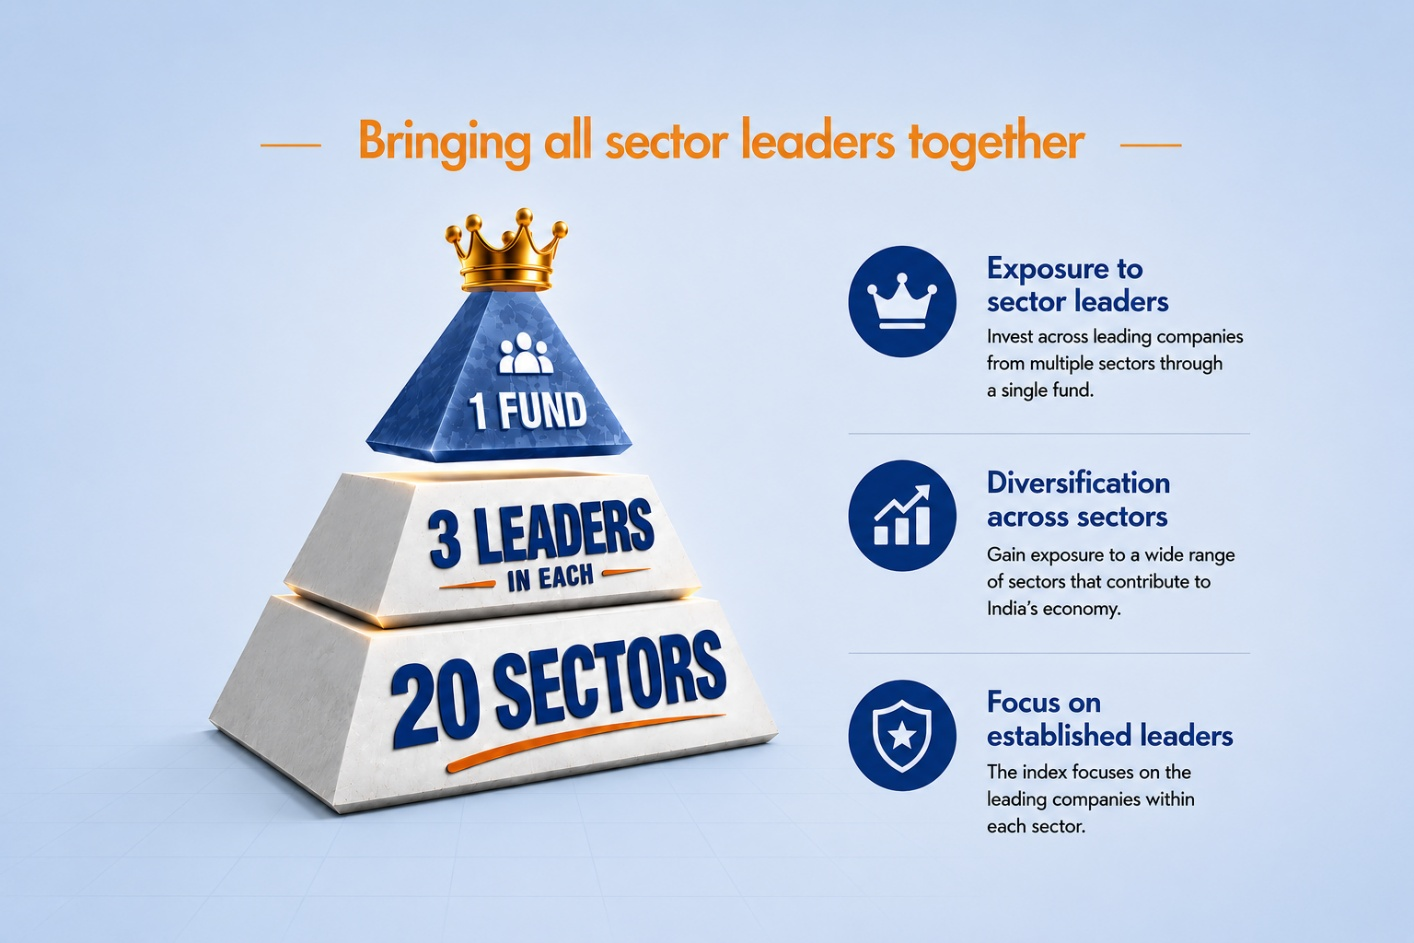
The BSE India Sector Leaders Index, developed by BSE Index Services, starts with the BSE 500 TRI as its universe and picks the top 3 stocks from every sector, ranked by six-month average market capitalisation.
Once a stock is included, it can be retained as long as it remains among the top 5 in its sector by full market capitalisation during semi-annual rebalancing. This keeps the portfolio from churning every time a company slips a spot or two. Weights are free-float market cap based, with a 5% cap and 1% floor per stock, and the index rebalances every June and December. In effect, you end up owning 60 stocks (3 from each of 20 sectors) that represent the strongest name in every corner of the economy, not just the biggest names overall.
Why that's different from a plain large-cap index
As of July 31, 2026, a portfolio built around the Nifty 50 puts 36.2% of its weight into Financial Services alone and covers just 15 sectors. The BSE India Sector Leaders index caps Financial Services at 14.3% and spans across 20 sectors, including Realty, Chemicals, Textiles and Media, none of which show up in the Nifty 50 at all.
Its top 3 sectors make up only 28.8% of the portfolio, compared to 54.2% for the Nifty 50, so roughly 71% of the fund's weight sits outside its biggest three sectors. That's a meaningfully more spread-out portfolio, and it still captures real economic weight, the top 3 companies in sectors like Construction, Telecom and Oil & Gas contribute 70% or more of their sector's market cap, sales or profit.
Source: BSE Indices. *Data as of 31st July 2026. The sector(s)/stock(s)/issuer(s) mentioned above do not constitute any research report/recommendation and the schemes may or may not have any future position in these sector(s)/stock(s)/issuer(s).
How the leaders have actually performed
Since the index's inception in June 2005, it delivered a 15.3% CAGR versus 13.6% for the Nifty 50 TRI, turning a ₹10 lakh lumpsum into roughly ₹2.03 crore against ₹1.48 crore, a 20x wealth multiplier versus 15x.
A monthly SIP of ₹10,000 since July 2005 grew to ₹1.29 crore versus ₹1.04 crore for the Nifty 50. Over 21 calendar years, the index beat the Nifty 50 in 14 of them, showed lower volatility in 13, and posted better risk-adjusted returns in 13.
On a rolling basis since 2005, it outperformed the Nifty 50 in 79% of 3-year windows and 88% of 5-year windows, with the outperformance widening as markets got stronger and the decline getting cushioned somewhat better when markets fell.
These figures represent historical performance of the underlying index, not the performance of the UTI BSE India Sector Leaders Index Fund or ETF, which are new schemes.
Source: MFI. Data as of July 31, 2026. Returns are CAGR. SIP returns are from 01-Jul-2005 and lumpsum returns from – 20th -Jun 2005. SIP returns are calculated assuming SIP of Rs.10,000 made on first day of every month. Past performance may or may not be sustained in the future and shall not be used for comparison with other investments. CAGR – Compounded Annualized Growth Rate. The figures pertain to performance of the index and do not indicate the returns/performance of the scheme. It is not possible to invest directly in Index.
The consistency behind the changes
Of the 142 unique stocks that have featured in the index, 20 have been retained from their first inclusion. These continuously held stocks have represented about 50% of the index's weight on average. UTI reports a 15.5% annualised return for these ‘consistent leaders’ over the period, versus 13.6% for the Nifty 50 TRI.
Names like ICICI Bank, HUL, L&T, Maruti Suzuki, Infosys and Bharti Airtel have stayed relevant across nearly two decades of change around them. So, while the index is designed to swap out laggards, it isn't churning for the sake of it, leadership that holds up gets to stay.
Period – 20th Jun 2005 to 31-Jul-26. The sector(s)/stock(s)/issuer(s) mentioned above do not constitute any research report/recommendation and the schemes may or may not have any future position in these sector(s)/stock(s)/issuer(s). Source: BSE Indices Ltd.
Where the leaders actually sit across market caps
As of July 31, 2026, large caps still dominate, making up 82.4% of the index across 43 stocks, but 10 mid-cap and 7 small-cap names round out the rest. Construction is the only sector where a large, a mid and a small-cap stock all made the cut in the same sector. Five sectors blend large and mid-cap leaders together, and three sectors, Diversified, Media & Entertainment, and Textiles, have their leaders entirely outside large caps. So, despite being a leadership-focused index, it isn't purely a large-cap play.
Source: BSE Indices Ltd. The 14 sector(s)/stock(s)/issuer(s) mentioned above do not constitute any research report/recommendation and the schemes may or may not have any future position in these sector(s)/stock(s)/issuer(s).
Two ways to invest
Both the ETF and the index fund track the same underlying index, so the choice comes down to how you'd rather transact. ETF units trade intraday on the exchange at prevailing market prices, but you'll need a demat account and bear your own transaction costs.
The index fund is priced once a day at closing NAV, pools transaction costs across investors, and can be held in physical or demat form with SIPs set up directly through the fund house.
Key terms to know
For the index fund, the minimum initial investment is ₹1,000, and subsequent investments under a folio also have a minimum of ₹1,000; amounts can be made in multiples of ₹1 thereafter. SIPs start at ₹500 for daily, weekly or monthly frequency and ₹1,500 for quarterly.
The ETF's minimum during the NFO is ₹5,000, in multiples of ₹1 thereafter, and trades in single-unit multiples on the exchange after listing. Neither carries an entry or exit load. Both benchmark against the BSE India Sector Leaders TRI, and their risk-o-meter currently reads "Very High".
Have you ever wondered why some companies from a decade ago still show up at the top of their sector, even as entire categories like cash payments or branch banking quietly got replaced? That interplay between consistency and change makes the UTI BSE India Sector Leaders Index Fund a distinct rules-based alternative for investors seeking diversified long-term equity exposure.
The central idea is simple: instead of concentrating on the biggest companies in the market, the index spreads exposure across the leading companies of 20 different sectors. However, investors should consider their risk appetite and investment horizon and read the scheme-related documents carefully before investing. The NFO closes on 11th September, 2026.
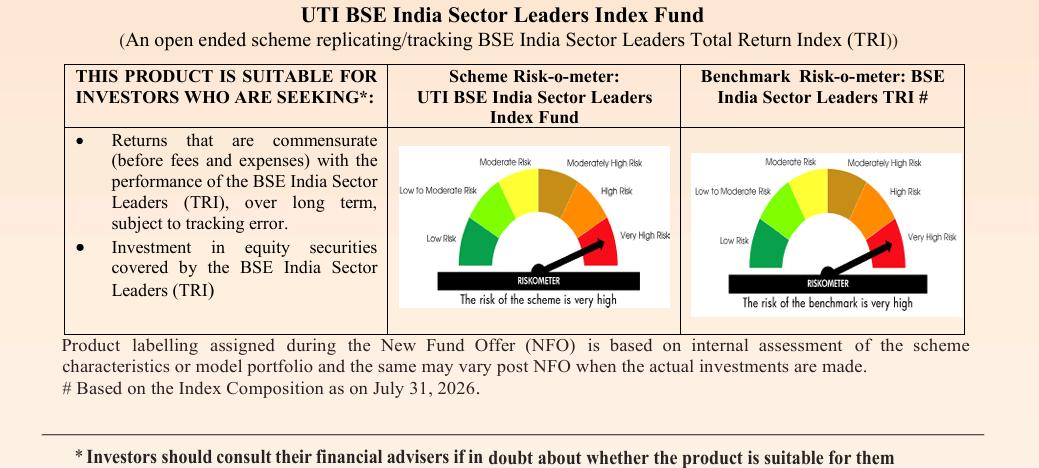
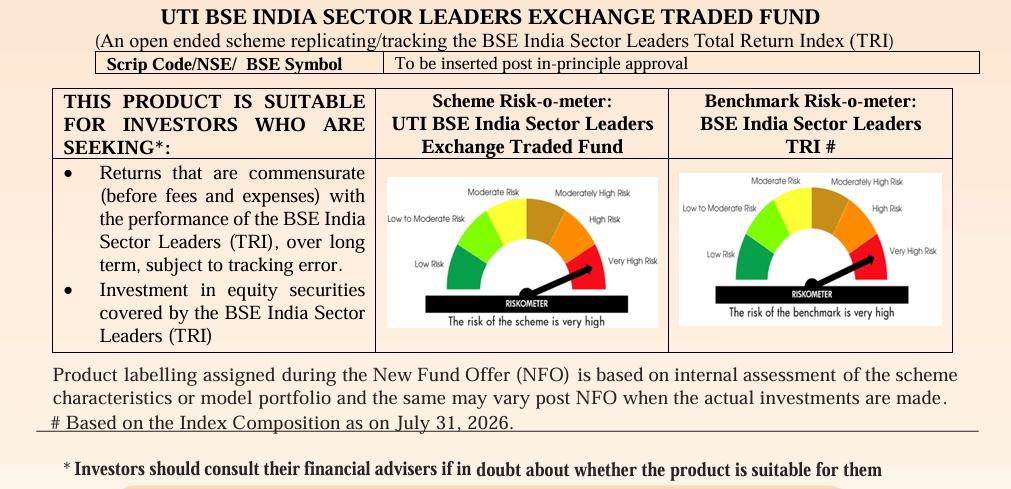
Mutual Fund investments are subject to market risks, read all scheme related documents carefully.