
The winning formula of high dividends and low volatility
 6 min
The Indian equity market has been cruising along with very low volatility over the last few quarters. However, suddenly, we saw the India VIX moving sharply up from the 10-15% range to ~ 20% over the past few weeks as of May 29, 2024. This sharp increase in volatility has awakened the participants from the comfort zone of an era of low volatility.
In this context, Dividend Yield Fund can be used as a vehicle to participate in the equity markets.
Dividend Yield (DY) strategy can be managed with two approaches:
i) The first is a high DY strategy with a focus on largely capturing the yields. This approach has a large sensitivity to interest rates as it is proxy to fixed income investment. The focus here is to invest in companies with a high DY.
ii) The second approach is to focus on the dividend growth strategy. This approach combines elements of yield as well as growth and hence looks at the total returns from income as well as capital appreciation.
We prefer to use the second approach for the UTI Dividend Yield Fund.
Conceptually, higher dividend yields provide downside protection during times of stress/market dislocations as some part of total return comes from yield as compared to companies that do not pay dividends.
In our case, the UTI Dividend Yield Fund has taken forward this theme of lower volatility in a more structured manner by planning to not take fresh exposure to the most volatile stock based on measures such as beta and standard deviation. To reduce the volatility of the fund, we have implemented ‘volatility-reducing measures’ such as avoiding taking any fresh exposure to the bottom 20% of stocks in terms of beta and volatility among the NIFTY 500.
We have managed to reduce the volatility of the fund by avoiding stocks that have the highest relative beta or highest standard deviations. This has helped us reduce the average beta of the portfolio as well as keep standard deviations of the portfolio below the benchmark.
Source: MFIE, UTI Research. Past performance may or may not sustain in the future.
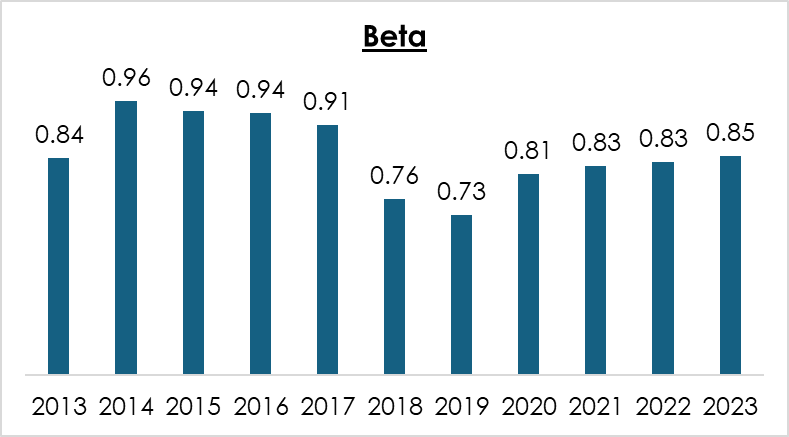
The above chart depicts the beta of the portfolio over the last decade. This has been consistently below the benchmark of NIFTY 500.
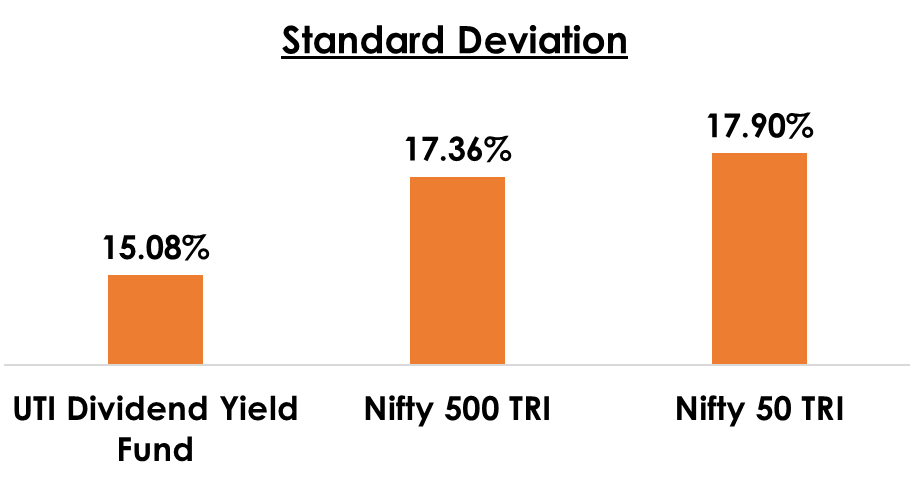
Source: MFIE, UTI Research. Data Period for Standard Deviation: 30/Apr/2009 – 30/Apr/2024. Past performance may or may not sustain in the future.
Our efforts to reduce volatility have also resulted in the standard deviation of the fund being significantly lower than the benchmark over longer periods.
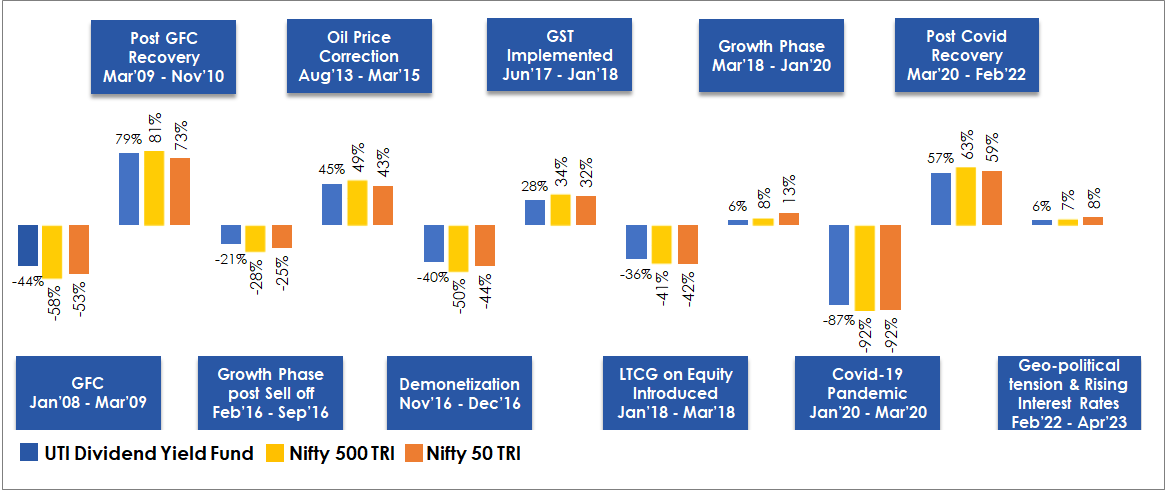
Source: MFIE, UTI Research; Returns <1 year – absolute & >= 1 year – CAGR. Past performance may or may not sustain in the future.
The table above clearly demonstrates the performance of the UTI Dividend Yield Fund during crisis periods, such as the GFC, the Eurozone debt or COVID-19, to be better than broader indices. The volatility of the return is also lower than the broader index.
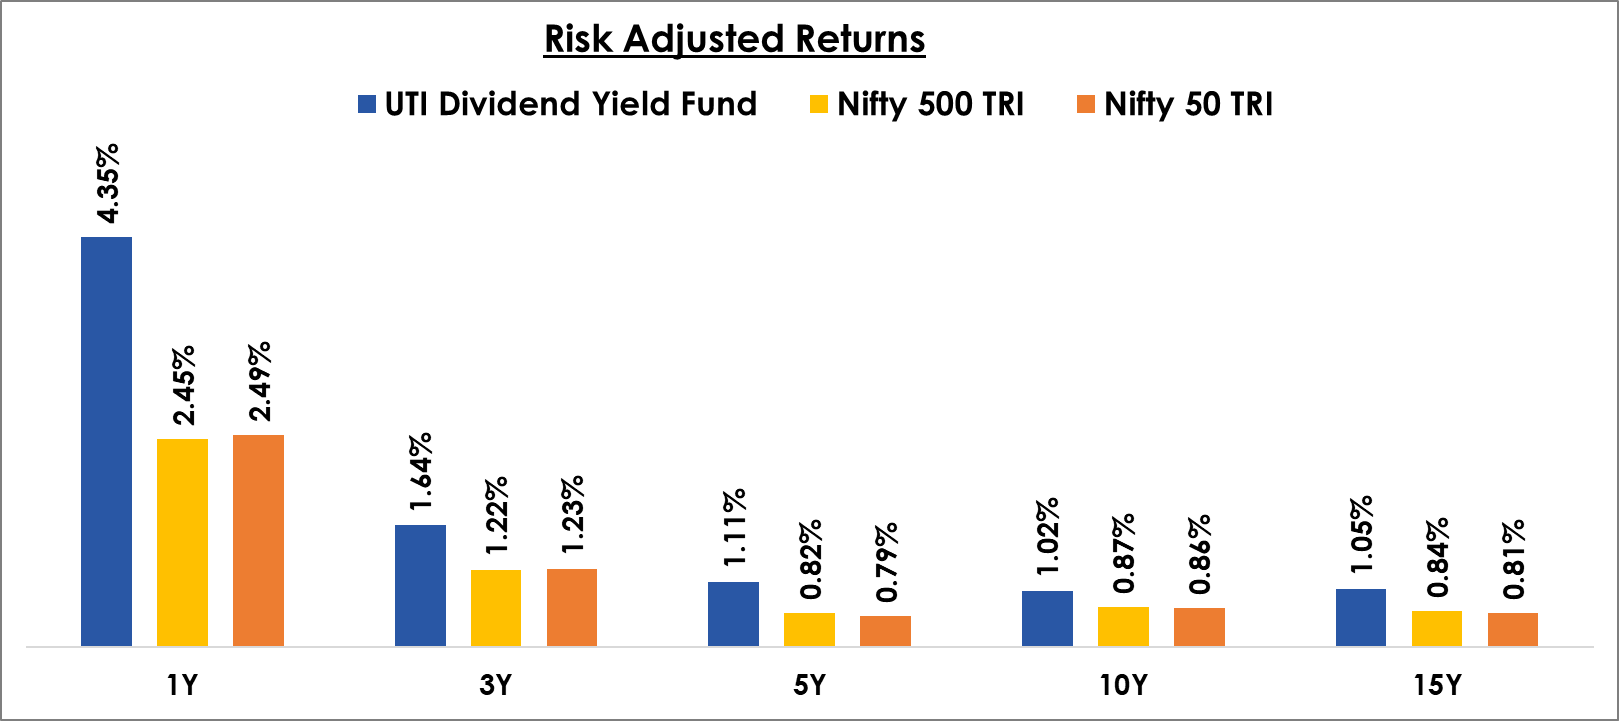
Source: Nifty Indices, UTI, MFIE; Data period: 30/Apr/2009 – 30/Apr/2024. Risk adjusted returns calculated using rolling Returns with daily frequency of UTI Dividend Yield Fund at difference time frames as mentioned above. Different plans have different expense structure. The performance details provided herein are of regular plan growth option. Past performance may or may not sustain in the future.
This has led to long-term as well as short-term returns of the UTI Dividend Yield Fund, turning out to be better than the benchmark on risk-adjusted basis as depicted in the graph above.
The more fundamental factors that reduce volatility is the factor of dividend-paying companies forming a predominant part of the portfolio.
Higher cash flow has been a hygiene factor in DYF, with more than 90% of exposure currently to C1 companies. While dividend-paying companies have relatively low capex requirements for growth, they also generate cash that reduces the possibility of the companies facing stress due to leverage. The theme ensures that the portfolio primarily comprises companies with clean balance sheets in terms of leverage as well as decent cash flow profiles.
Further, we have noticed that many of the companies that have traditionally paid high dividends as well as shown steady growth in dividends belong to relatively better quality, stable sectors such as FMCG and IT. Typically these are sectors with high pay-out ratios, high ROIC and stable cash flows.
The UTI Dividend Yield Fund also has a high share of R1 stocks at 60-65% with a blend of companies with high DY and consistent dividend growth. Currently, the Fund has a higher dividend yield, cheaper valuation, better return profile and lower risk compared to the benchmark.

Source: Nifty Indices, UTI, MFIE; BM – Benchmark (Nifty 500 TRI). Data as of April 30, 2024
In summary, we are trying to provide investors with a portfolio that has lower volatility and resultantly better risk-adjusted returns as compared to the benchmark.
The source of lower volatility is firstly through investing in stocks that pay some dividend, which is a more stable source of returns. Additionally, our efforts are to reduce volatility further by avoiding fresh exposure to stocks that are at the bottom 20% of NIFTY500 in terms of the market-based volatility measures that we use. Additional drivers of low leverage, decent cash flow profile and high ROIC provide further cushion to fundamental performance.
On a long-term basis investors looking to reduce the risk of volatility in the portfolio yet willing to take risks of equity investing should consider the UTI Dividend Yield Fund as a part of the core portfolio.
Performance of the scheme in the SEBI format:
|
Period |
Return (%) |
Growth of ₹ 10,000/- |
||||||
|
Scheme |
Tier 1 B: Nifty 500 TRI |
Tier 2 B: Nifty Dividend Opportunities 50 TRI |
AB: Nifty 50 TRI |
Scheme |
Tier 1 B: Nifty 500 TRI |
Tier 2 B: Nifty Dividend Opportunities 50 TRI |
AB: Nifty 50 TRI |
|
|
1 Year |
44.90 |
39.26 |
51.87 |
26.51 |
14,490 |
13,926 |
15,187 |
12,651 |
|
3 Years |
21.10 |
20.52 |
27.67 |
16.92 |
17,769 |
17,514 |
20,823 |
15,990 |
|
5 Years |
18.04 |
18.02 |
19.79 |
15.30 |
22,937 |
22,918 |
24,691 |
20,393 |
|
Since Inception |
15.35 |
15.53 |
18.22 |
15.27 |
150,895 |
155,434 |
240,729 |
148,808 |
B - Benchmark, AB - Additional Benchmark, TRI - Total Return Index
Past performance may or may not sustain in the future. Different plans shall have a different expense structure. The performance details provided herein are of regular plan (growth option). Returns greater than 1 year period are Compound Annual Growth Rate (CAGR). Inception of UTI Dividend Yield Fund: 23/May/2005. Date of allotment in the scheme/plan has been considered for inception date. The scheme is currently managed by Mr. Amit Premchandani since Nov 2022. Period for which scheme’s performance has been provided is computed basis last day of the month-end preceding the date of advertisement.
For performance of other schemes managed by the fund manager, click https://www.utimf.com/statutory-disclosures/performance-fund-manager-wise
|
UTI Dividend Yield Fund An open-ended equity scheme predominantly investing in dividend yielding stocks |
Scheme Riskometer |
Tier-I Benchmark: Nifty 500 TRI |
|
This product is suitable for investors who are seeking*:
*Investors should consult their financial advisers if in doubt about whether the product is suitable for them. |
|
|
 Investors understand that their principal will be at Very High Risk.
#The Risk-o-meter of the fund/s is/are evaluated on monthly basis and any changes to Risk-o-meter are disclosed vide addendum on monthly basis, to view the latest addendum on Risk-o-meter, please visit the addenda section on https://www.utimf.com/downloads
The views expressed are the author’s own views and not necessarily those of UTI Asset Management Company Limited. The views are not investment advice and investors should obtain their own independent advice before taking a decision to invest in any asset class or instrument.
Mutual Fund Investments are subject to market risks, read all scheme related documents carefully.

Discover more topics
Don't miss any update
Be the first to get exclusive offers, articles and news on our product directly in your inbox.


